Current User: None

What is pageInspector?

pageInspector is an experimental web-page analyzer/visualizer to help users and web admins to inspect third party domain inclusions. The tool is capable to provide detail information on how each third party domain appears in a web-page either directly (from the web-page owner/admin) or indirectly from another third party domains already loaded in a web-page.


Functionalities

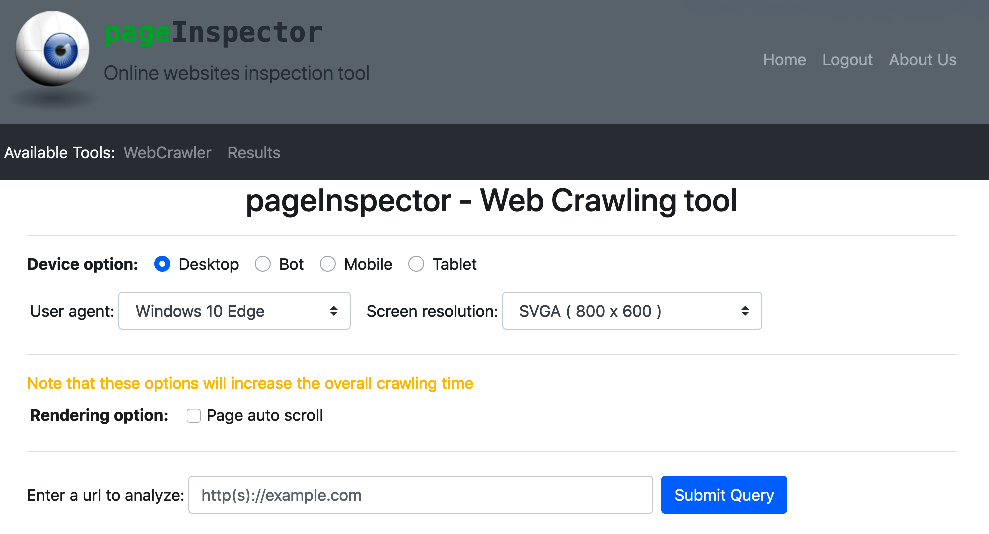
1. Web crawler interface
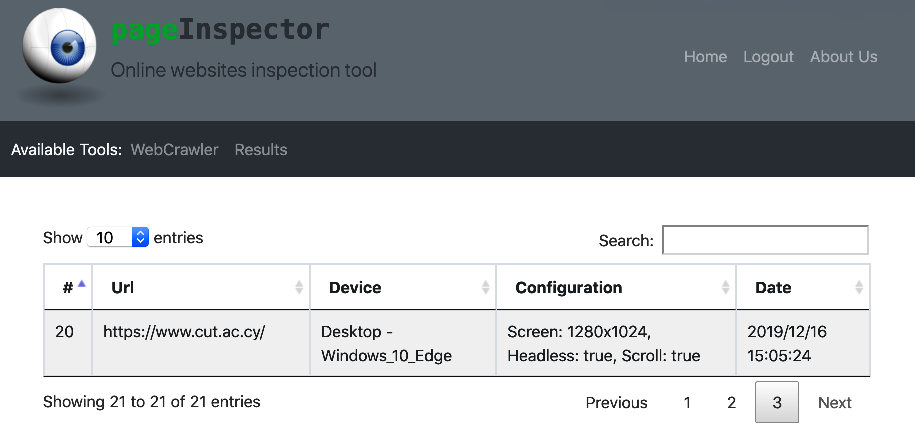
crawler options
The crawling interface allows the user to select from a list of different device options such as desktop, tablet or mobile device or even a web bot. In the case of desktop and web bot the user is also able to define the screen resolution from a list of pre-defined set of the most common screen resolutions. Autoscroll functionality is also available.

2. Results table
The results table holds the total number of successful page requests for each individual user of the system. For each page request the table shows the visited URL, the device configuration that the user select along side with the basic configuration options, such as, screen size, auto-scrolling, etc. Finally the last column holds the time and date that the requests was executed. The user can click to any of the table entries to get more details related to the request.
The results table page

3. Result page
Results page

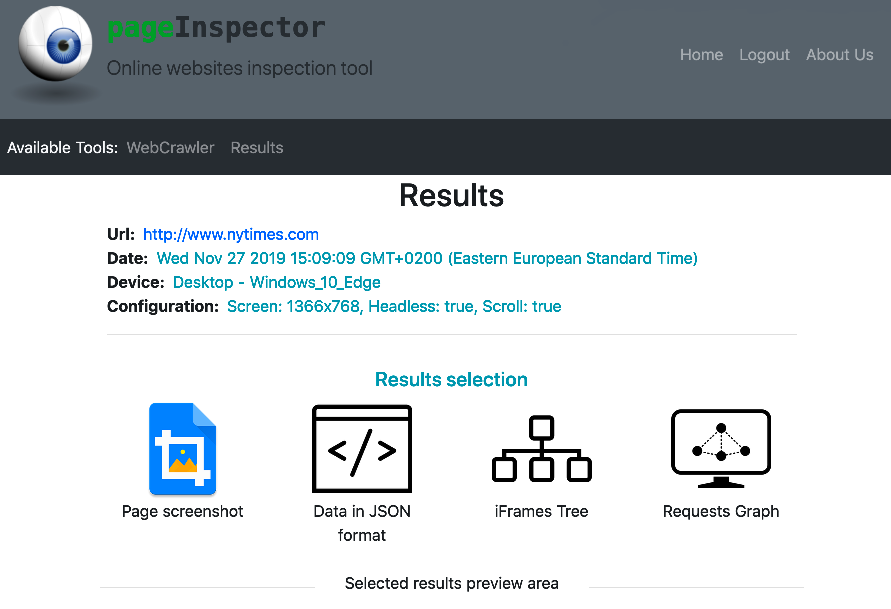
The result page allows the user to interact with the web-page data either by searching directly the raw data, visualized as a JSON Object, or by using the different visual representations of the web-page rendering information in the form of graphs.

The four main results are the following:

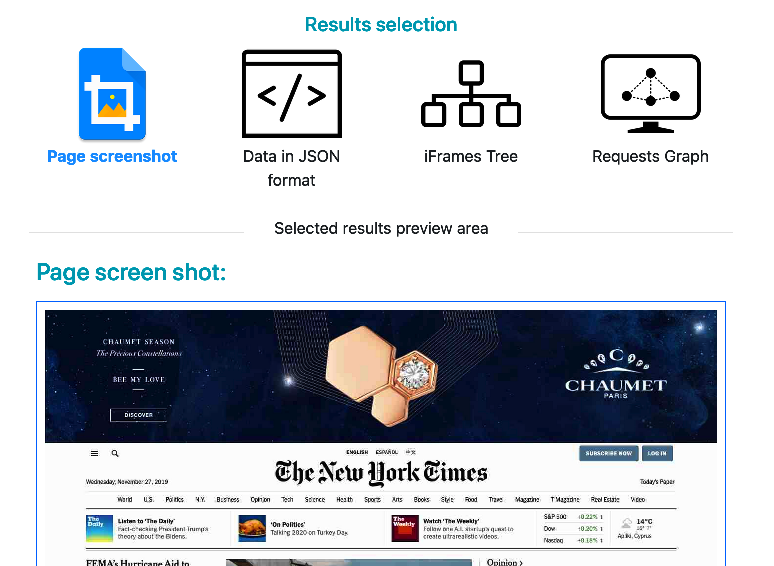
  1. Screenshot of the web-page for visual inspection.
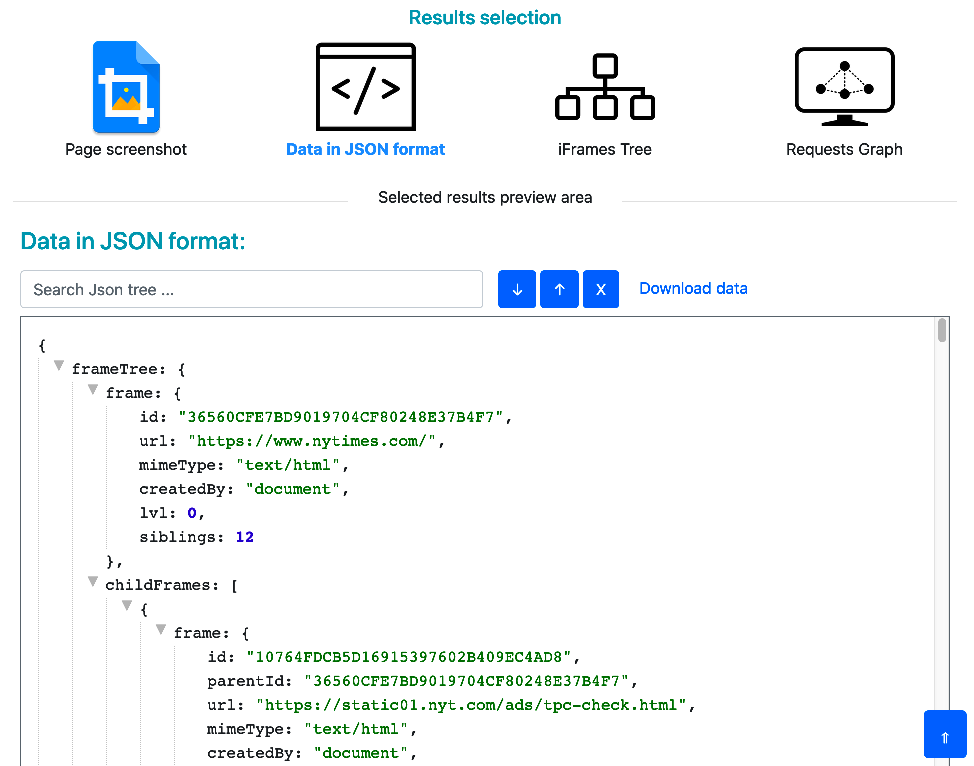
  2. The raw data in JSON format, also available to download.
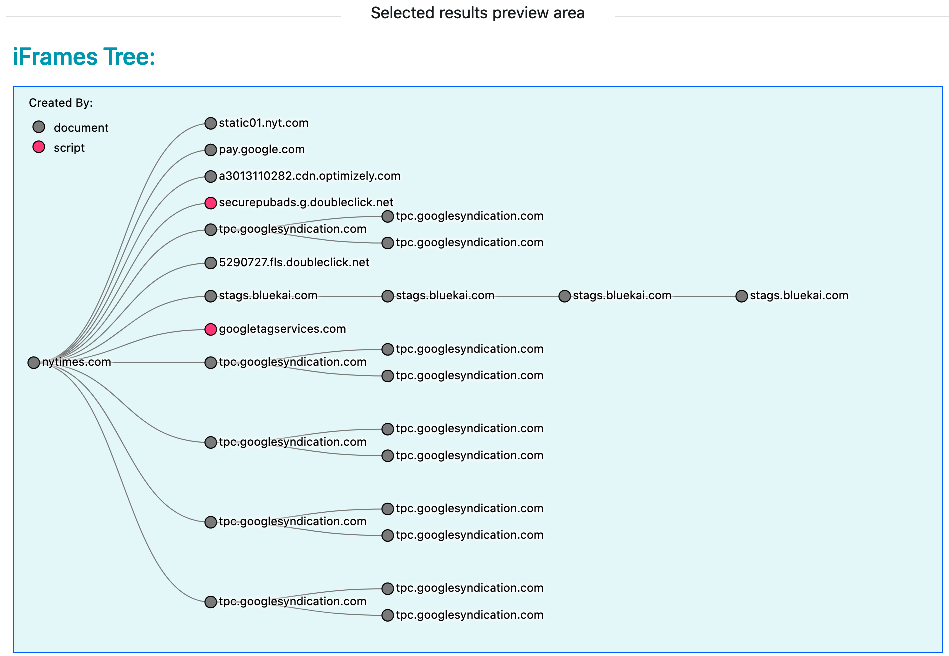
  3. The web-page iFrames tree visualization.
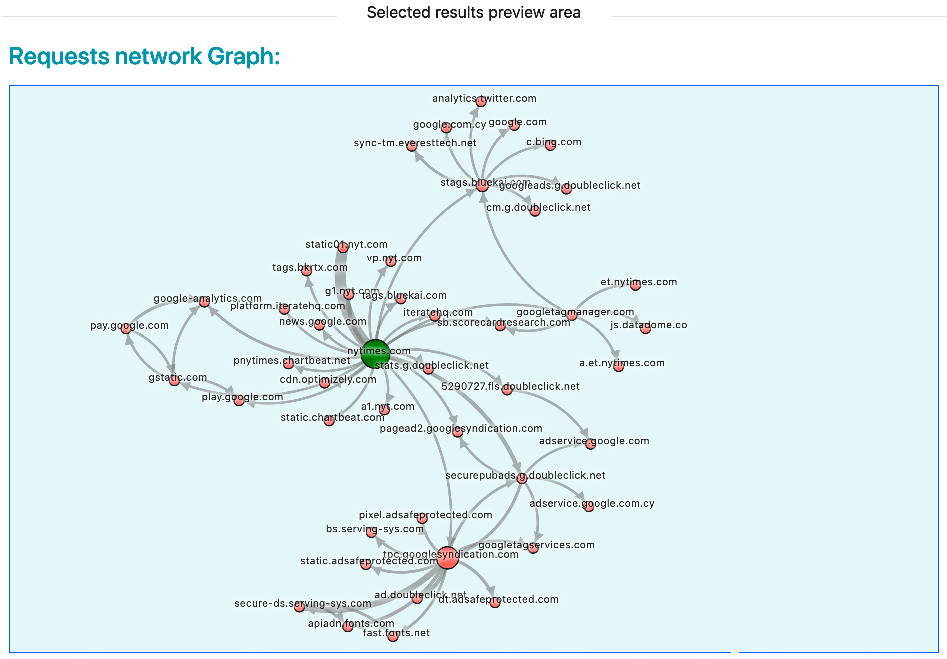
  4. The visualization of all http(s) requests of the web-page as a directed graph.

3.1. Page screenshot
The user can visually inspect the web-page content using the available full page screen shot of the page. The user can also click on the page image to open it in a new tab in full page mode or right-click to download it.
Page screenshot

3.2. Page requests in JSON format
Page requests in JSON format
The user can also interact with the raw data that the tool collects during the rendering time of the requested web-page. The data are presented as a formatted JSON object with additional support functionalities such as keyword search and node expand/collapse capabilities. In addition, the user can download the raw data in JSON format for additional offline analysis or any other use.

3.3.1. Page iFrames tree
The iFrame tree graph presents the relationship between iFrames within the web-page. Using this graph the user can easily identify nested iframes, that is, iFrames created within other iFrames.
Page iFrames tree

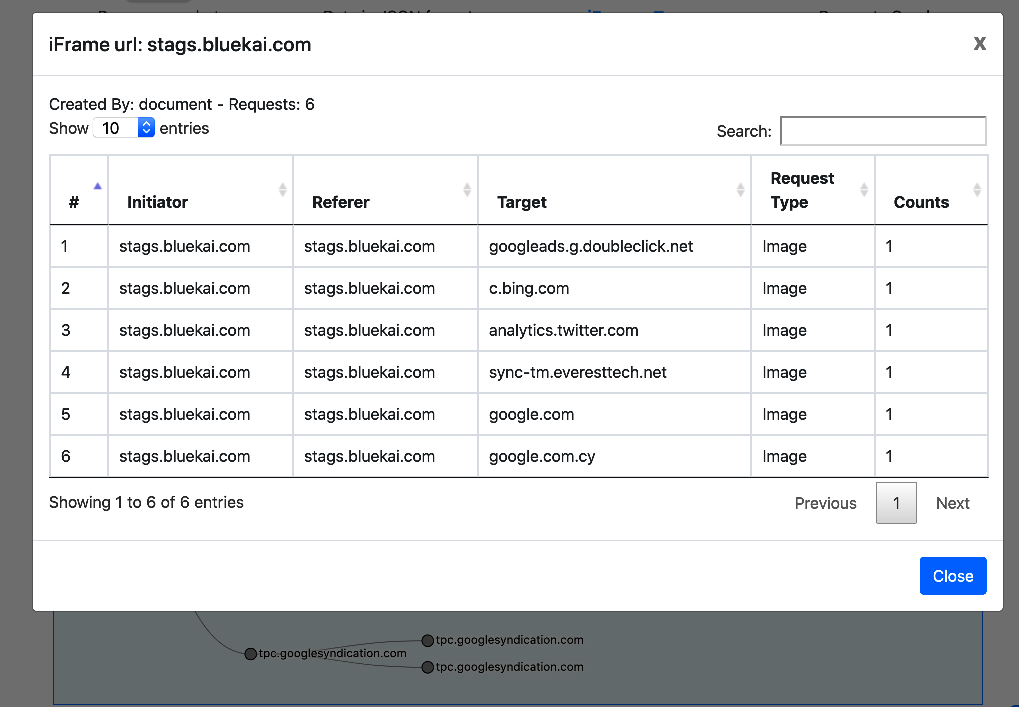
3.3.2. Page iFrames tree popup
Page iFrames tree popup
By clicking on the nodes of the iFrame tree graph, the user is presented with a popup tables that provide more details related to the requests that each iFrame initiate during the rendering time of the page. The tables provide information such as the initiator domain, the referer domain found in the request header, the target domain of the request, the request type and finally the total number of observations of each request type.

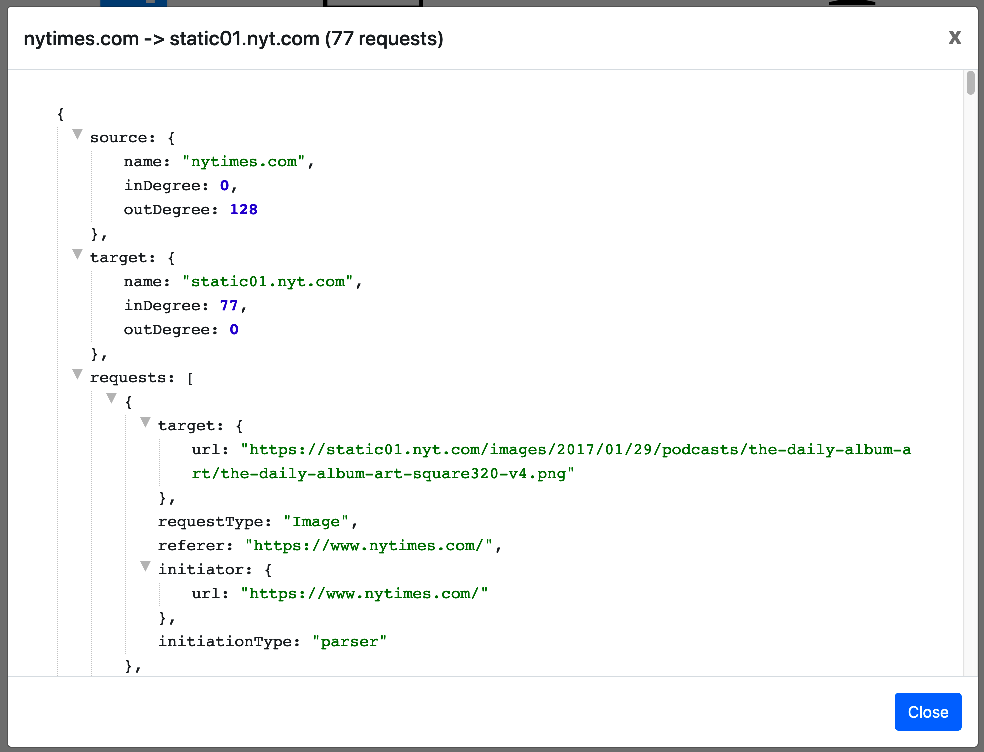
3.4.1 Page requests graph
The requests graph depicts the relationship between initiator domain and target domain for all the requests observe during the rendering time of the page. This graph allows the user to observe relationships between first and third party domains included within the web-page.
Page requests graph

3.4.2. Page requests graph popup
Page requests graph popup
The user can click on any of the edges depicted in the request graph to get more details related to the information exchange between the two node domains in the graph. The popup shows the raw http(s) requests in JSON format between the two domains. The popup allow the user to search the JSON object, and expand/collapse different entries of the object.